What is a graphic organizer?
Graphic organizers are visual thinking tools that make pictures of your thoughts. The pictures demonstrate relationships between facts, concepts, or ideas, and guide your thinking as you design the map or diagram.
People who have learning disabilities are often visual learners and thinkers. That means they understand and remember information better when ideas, words, and concepts are associated with pictures, diagrams, charts, and maps.
Why use graphic organizers?
Graphic organizers can help to visualize and construct ideas, organize and/or sequence information, plan what to write, increase reading comprehension, brainstorm, organize problems and solutions, compare and contrast ideas, show cause and effect, and more. The ability to color-code thoughts in a picture can help significantly in understanding and remembering the information.
Graphic organizers can be created for something as simple as a shopping list or as complicated as structuring business components or writing a thesis.
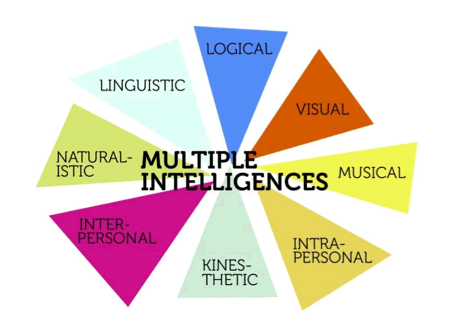
Different types of graphic organizers
There are many different types of graphic organizers. Some are made based on the specific goal, like showing overlapping relationships or visualizing a process. There are literally thousands of free templates available online – just search for “free graphic organizers.” The following are samples of only a few types of graphic organizers.
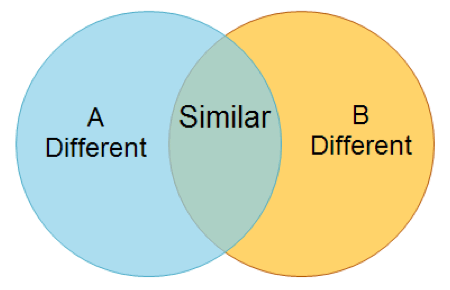
Venn Diagrams
Venn Diagrams show how different things or ideas can overlap to show a compare/contrast relationship.
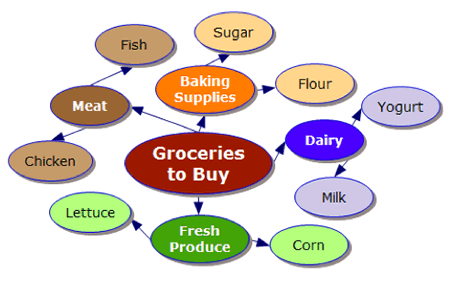
Concept Maps
Concept Maps are good for organizing information, brainstorming, visualizing ideas, and planning what you want to write.
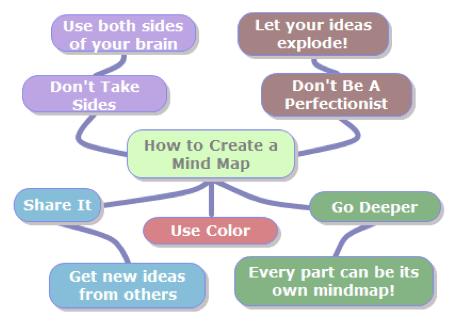
Mind Maps
Mind Maps are used to visually represent hierarchical information that includes a central idea surrounded by connected branches of associated topics. They work well for brainstorming ideas, solving problems, and showing relationships and/or components in a process.
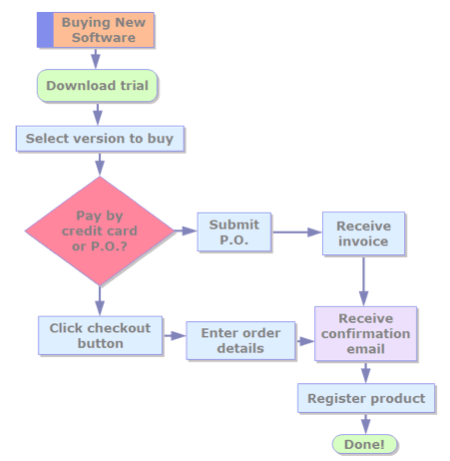
Flow Charts
Flow charts are graphic organizers that show how steps in a process fit together. This makes them useful tools for communicating how processes work and for clearly documenting how a particular job is done. Mapping a process in a flow chart format can help clarify the process, and show where the process can be improved.
Resources for Graphic Organizers
To learn more about graphic organizers
Free graphic organizer websites (not a complete list)
Free graphic organizer apps (not a complete list)


